“Do not be embarrassed by your failures, learn from them and start again”. Richard Branson.
This article was originally published on LinkedIn, November 20th 2022
Introduction
Although I’m not an expert in Instrumentation & Automation, I have worked with precomissioning teams using “Cause and Effect” (C&E) matrices. However, I often noticed how those spreadsheets could have been faster and more practical in getting the correct information.
Furthermore, the matrix spreadsheet often has many columns and rows that they have to be printed in multiple plotter-size sheets wallpapering the meeting rooms. So, I thought that there were better ways to do it, and here below, I’m presenting a case study.
Case Study: Cause and Effect Test Pack Management
The goal is to execute the “Cause and Effect” functional check when the initiator and actuator have completed their precomissioning checksheets.
To achieve this goal, the idea is to group C&E Function test packs with the initiator/actuator test documentation completed to prepare a baseline plan.
The typical approach
The typical approach in most of the projects, is the matrix representation in spreadsheets, where the list of initiators are listed on the frozen columns to the left and the actuators are columns to the right (with some few frozen rows at the top for the tag, description and B checksheet).
The crossings cells of the rows(initiator) vs columns (actuator) are filled with the effect (Cl – Close Valve, OP – Open valve, SD – Shutdown device), etc
I understand that spreadsheets are easy to operate. However, the more records and fields ( columns and rows), the sooner headaches appear.
A 600 initiators /500 actuators spreadsheet matrix, represent 300,000 cells. How many of them are actually filled (effect) cells?
See, for instance, a case of a project with 600 initiators and 500 actuators (small-medium size project). Scrolling right and down, zooming in and out across a matrix of 300,000 cells, turns any spreadsheet sluggish, not to mention when loaded with VLOOKUPS and other formulas.
A customized application using MS Access – VBA – SQL
As I stated at the beginning of the article, I’m not an instrumentation expert, but I do know how to manage data effectively.
The video below shows how selecting the initiator also dynamically changes the actuator (no need to scroll and zoom).
At a glance, we can determine what inputs have completed their B sheet. “A” checksheets are inferred as completed but if wished a customized field or button could fetch the status.
Opening completed the initiator/actuator B checksheets and their PID
Instead of manually locating intersections turned green or blue, the customized application has a field that automatically turns itself into a checkmark on a green background. Also, the field becomes a button to open the actually completed checksheet.
To open search by subsystem, Tag
Other functionality to quickly search tags or subsystems is shown below. A search pop-up box to filter and locate a specific tag or group by subsystem.
Quick access to folders
Instead of jumping into other applications, customized buttons right in the dashboard could directly open the PID, B Checksheets, or LPD folders.

To prepare Cause and effect checksheet
A customized button generates the below “Cause and Effect” Checksheet (or Testsheet).

Here we can see how to prepare a “Cause and Effect” checksheet, which could also be generated in bulk by subsystem or any other criteria.
Benefits of this customized application
- Quickly and dynamically search the actuators impacted(effect) by any initiator (Cause).
- Quickly verify their Precomissioning completion B checksheet status
- If wished, quickly open the PID and/or the Loop Diagram for validation or consultation
- Quickly generate the “Cause and Effect” checksheet and consolidate them with the related documentation for reference.
- Quickly search and/or filter by initiator Tag or by subsystem
- Quickly access to the PID, Instrument Folder or B checksheet folder for consultation.
- Generate “Cause and Effect” (C & E) completion status reports by subsystem, loops, area, etc
Conclusions
I understand that spreadsheets are easy to operate; however, the more records and fields ( columns and rows), the slower performance. Scrolling right and down, zooming in and out across a matrix of 300,000 cells, turns any spreadsheet sluggish, not to mention if it is overloaded with VLOOKUPS and other formulas.
I invite you to think “outside the box” with a customized MS Access -VBA – SQL application.
The power of database techniques and structures in combination with VBA scripting is far superior to spreadsheets and VLOOKUPS.
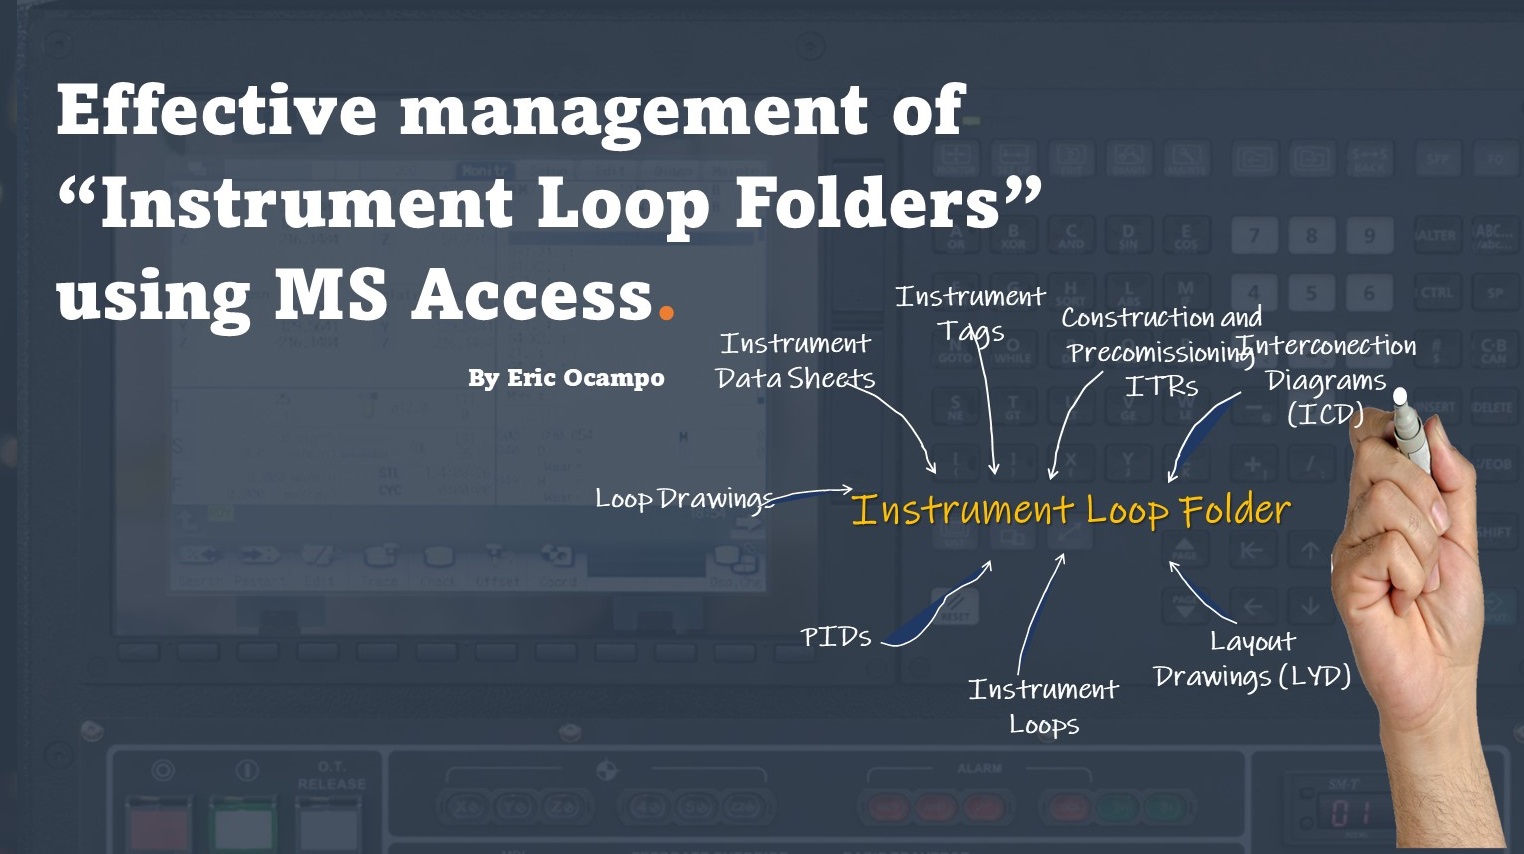
Thanks for your feedback and comments on my previous LinkedIn article: “Effective management of Instrument Loop Folders” I do welcome them.
Qatar 2022 World Cup has just started today; I have always been a big fan of World Cups and will attend some first-stage matches next week. I will be glad to visit Qatar after ten years since I last worked there.
This is the last opportunity to see Messi and CR7 in a World Cup, two of the best players in history. Argentina, Germany, Brazil, and Belgium are my favorites to win the World Cup. France is no longer among my favorites since Benzema, the winner of the Ballon d’Or, is out of the tournament due to an injury.
If you enjoyed this LinkedIn article, feel free to comment, like, or share it.
Thank you!
Eric Ocampo
ericocampo@ericocampo.com
www.ericocampo.com


