This article was originally published on LinkedIn, Aug 16th 2021
“Problems are not stop signs, they are guidelines.” Robert Schuller
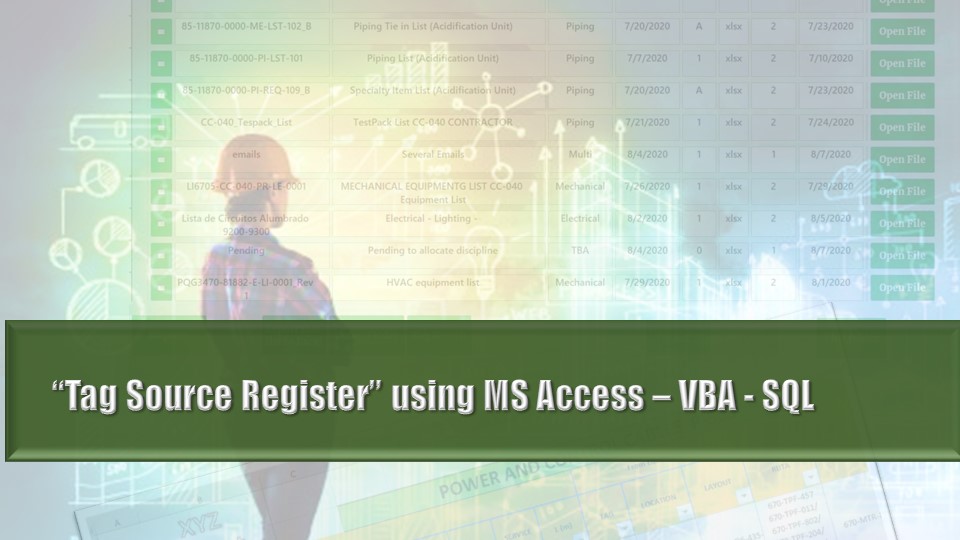
In EPC projects, regardless of the existing reports in the Completions Database System used by the project (i.e., GoCompletions©, WinPCs©, MCPlus© or Smart Completions©), very frequently, there is a need to work on its data exports to generate customized reports; most of the time the immediate recourse is Excel or MS Access.
The advantage of using MS Access is the data robustness, and, in combination with VBA scripts, it offers flexibility to run almost any type of calculations in the background. The results are powerful and quickly compiled reports.
Here are some of the reports that could be generated using MS Access-VBA-SQL.
A disclaimer note : “Mote Expansion Project” and data shown below are fictitious and used only for demo purposes.
1.- Construction Completions A – ITR Reports
During the construction progress, it is important to have a quick view not only of the discipline but a bit further; the type of critical construction work in progress.
Certainly, each project would have different requirements of what to display in the report but, this is an example:
In “Civil” discipline we could include grading, grouting, etc.
“Structural” discipline could include the construction progress in grating, supports, roofing, decking, etc
TestPacks would include Service tests, Hydro tests, Pneumatic, etc.
Electrical could be split in equipment and cables, or further separate the motors out of the equipment, etc.
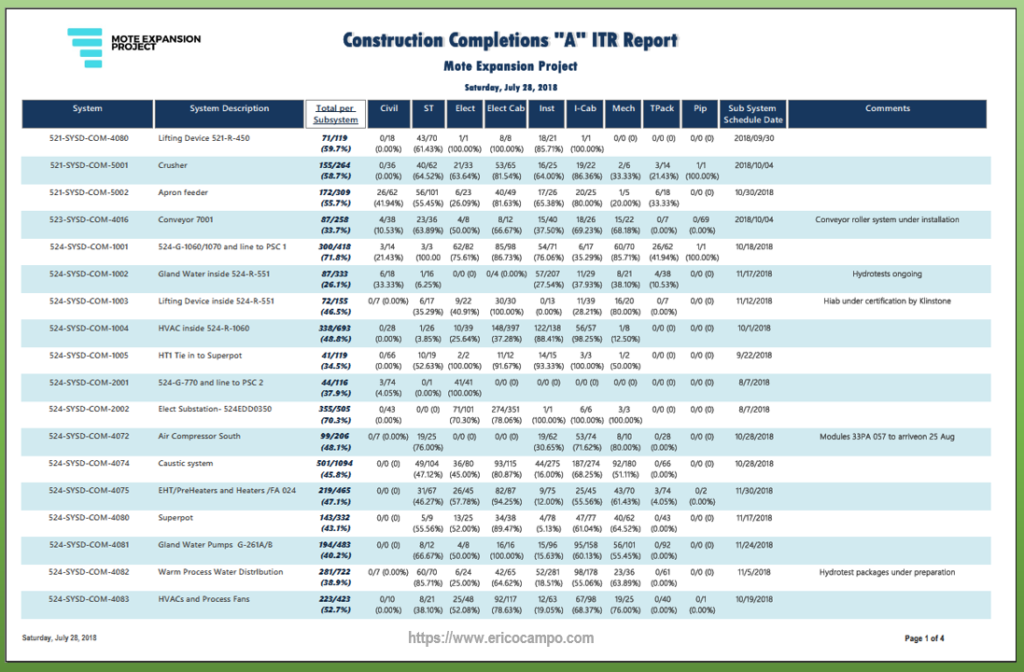
This is a useful report during the daily construction war room, in addition to the dynamic use of a construction completions dashboard, which I will discuss in a future post.
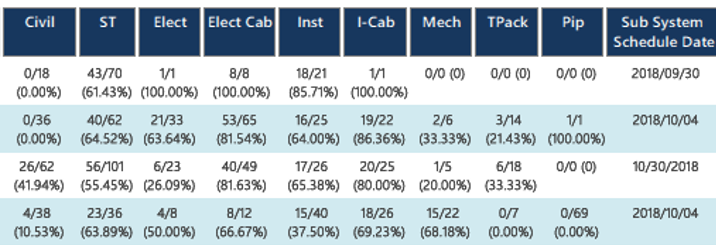
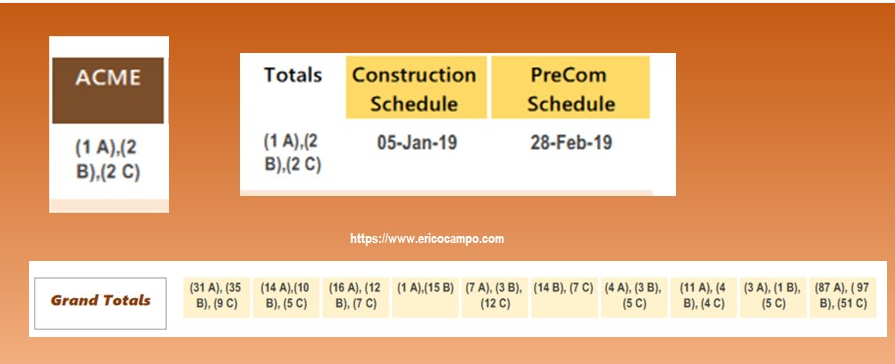
At the bottom the Grand Totals and the last two columns show the construction schedule date and any comments.
2.- Precommissioning Completions B – ITR Reports
For the precomissioning team, the image below shows an example:
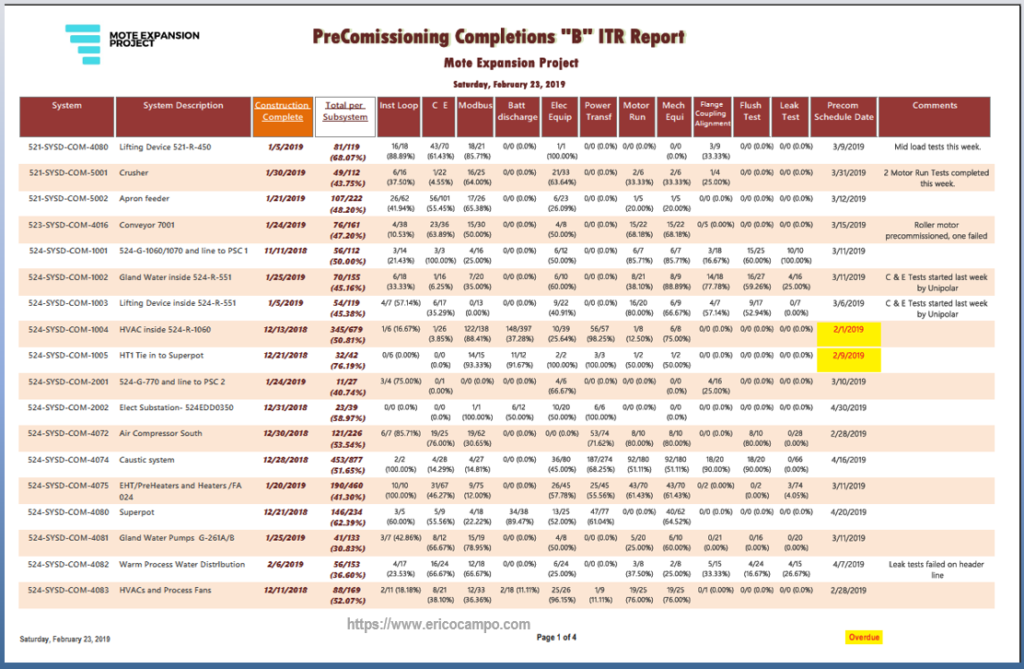
Instrument might be split into instrument loops, cause and effect, Modbus tests, miscellaneous instrument equipment, etc.
For Mechanical, precomissioning might include motor runs, pump alignments, miscellaneous mechanical equipment, etc
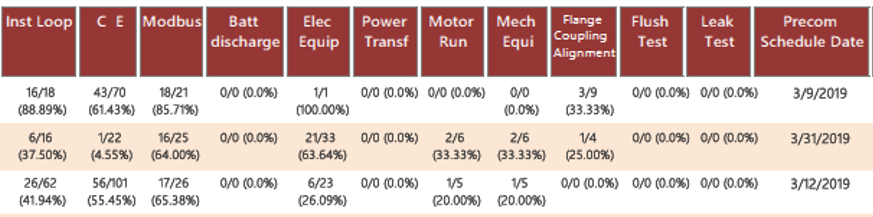
Electrical precomissioning tests could be split into battery discharge, power transformers, and miscellaneous equipment.
In piping, possible entries include flush, leak tests, and miscellaneous tests.
Again, this is only an example, and each project will very likely have different criteria of what to display.
For the precomissioning team, it is important to have the construction completed and/or scheduled dates visible in the report.
3.- Oustanding Punchlist Summary by Actionee
For the punchlists, it is not only the category and the subsystem but it is equally important to clearly visualize what entity or actionee is responsible for fixing the deficiency (either Contractor, Subcontractor, Client, Vendor or Project Management Team).
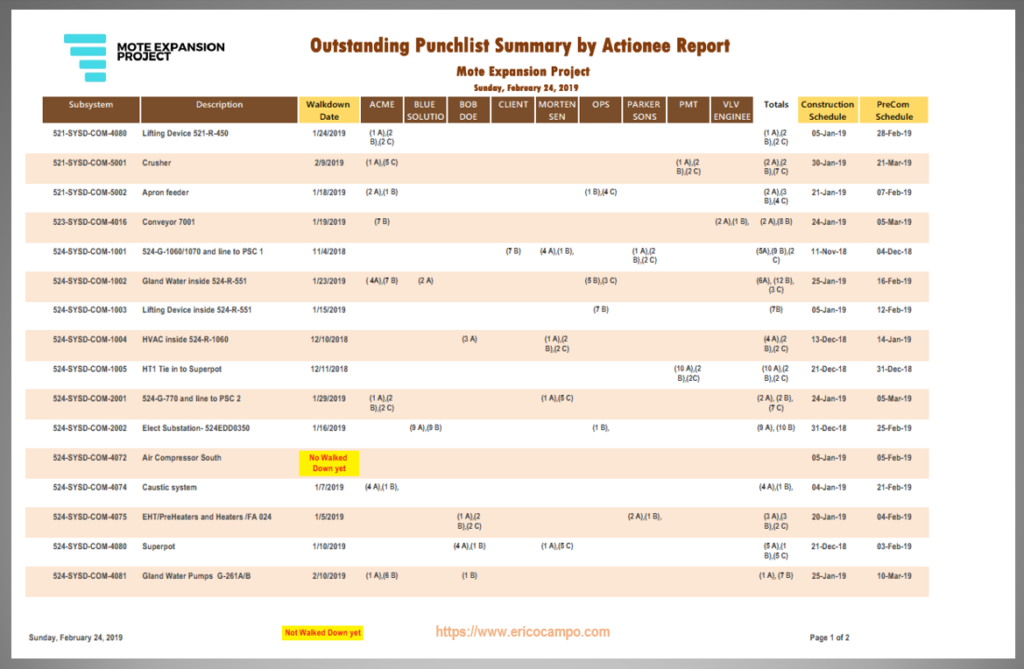
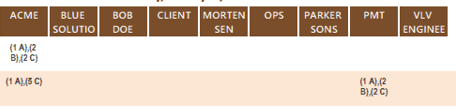
Only one cell is used to show the outstanding and category-concatenated punchitems.
This report also shows the totals, and the last two columns show the construction and precommisioning schedule dates as target reminder for the clearance of “A” punches before the construction schedule date and “B” punches before the precom schedule date.
The report automatically flags in yellow those subsystems that have not been walked down.

4.- Completions and Subsystem Turnover Summary
A basic completions summary shows the A, B ITRs, punchlist, NCR, and RFI status per subsystem in one report. The report shown below splits the subsystem by contractor too.
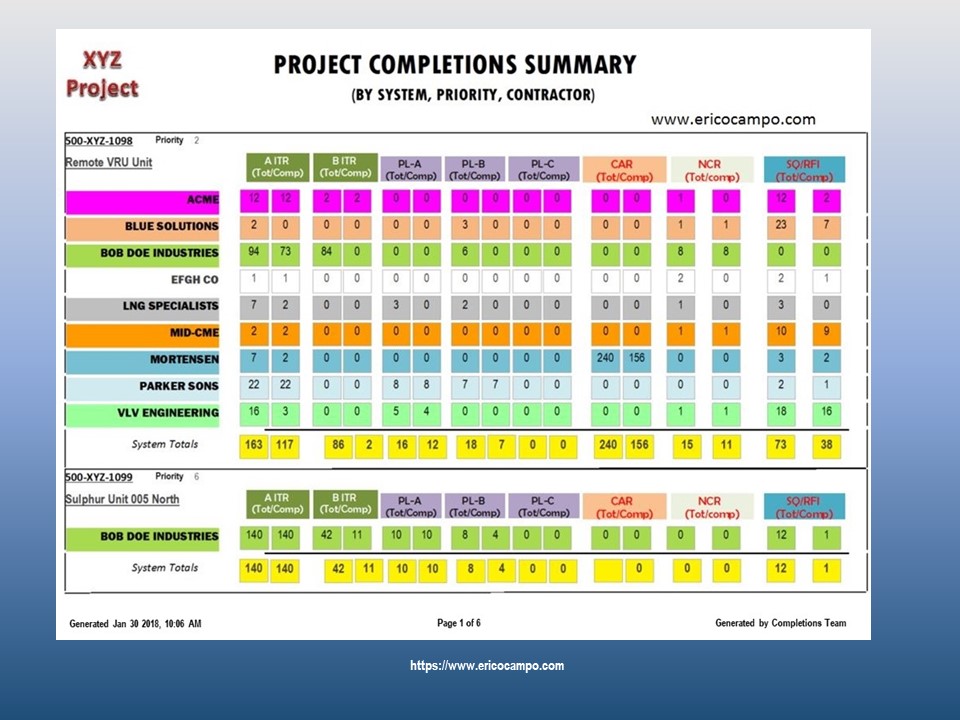
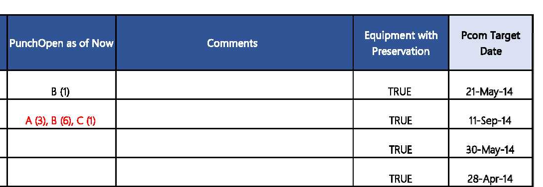
This other report use only one cell to display the complete/total for each of the A, B ITRs and punchlists. Also, the report automatically turn blue those that are indeed complete and in red those “A” Punchlists that are withholding the Construction completion approval.
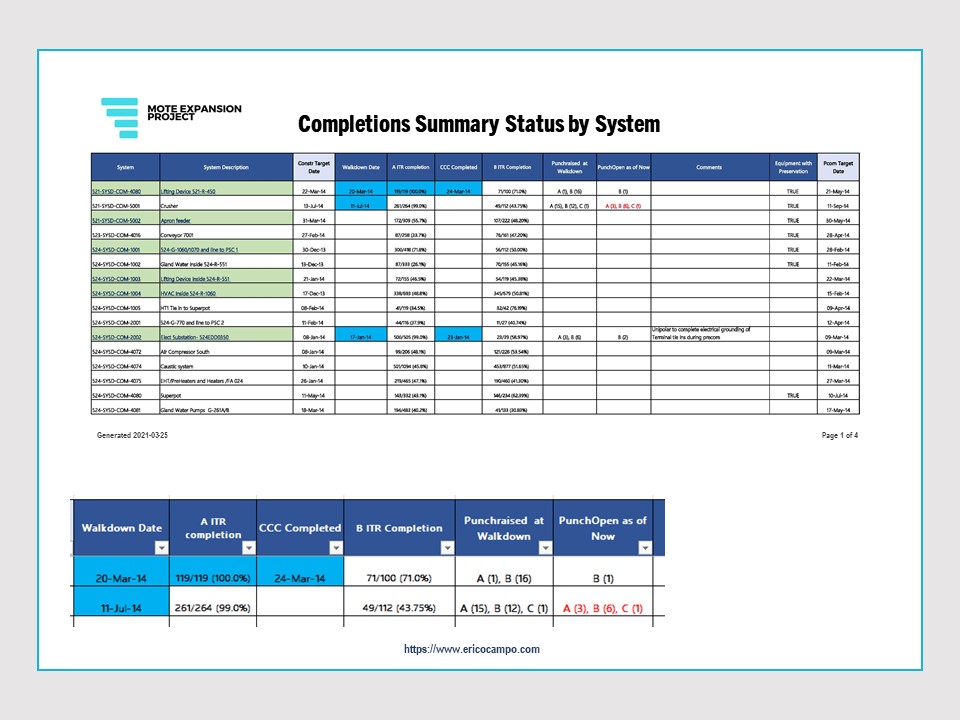
It also shows if there are equipment under preservation in the subsystem and its Precommissioning target date
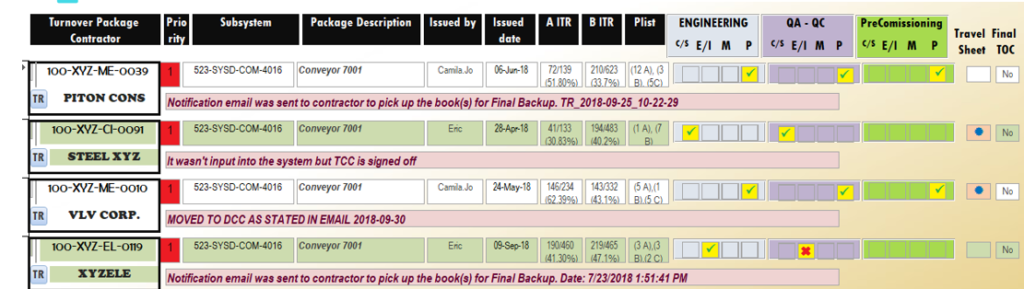
A more comprehensive report to include the Turnover revision process from the different disciplines and groups is shown below. In this example the Turnover Packages are split by contractor too.
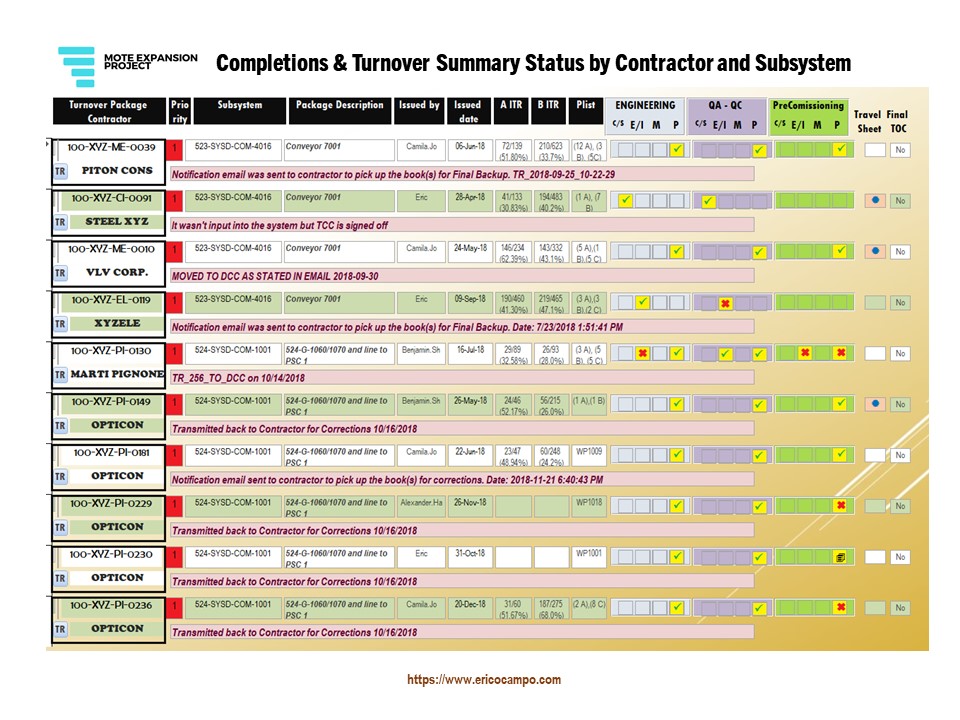
In this example 4 different contractors have a scope in the “Conveyor 7001” system and each of them have to submit their TOP for review before acceptance. Comments during the back and forth process are shown as part of the tracking process. Green checkmarks represent approval from discipline after reviewal, red “X” reflect rejections and Turnover Package has to be returned to the contractor to fix the issue.
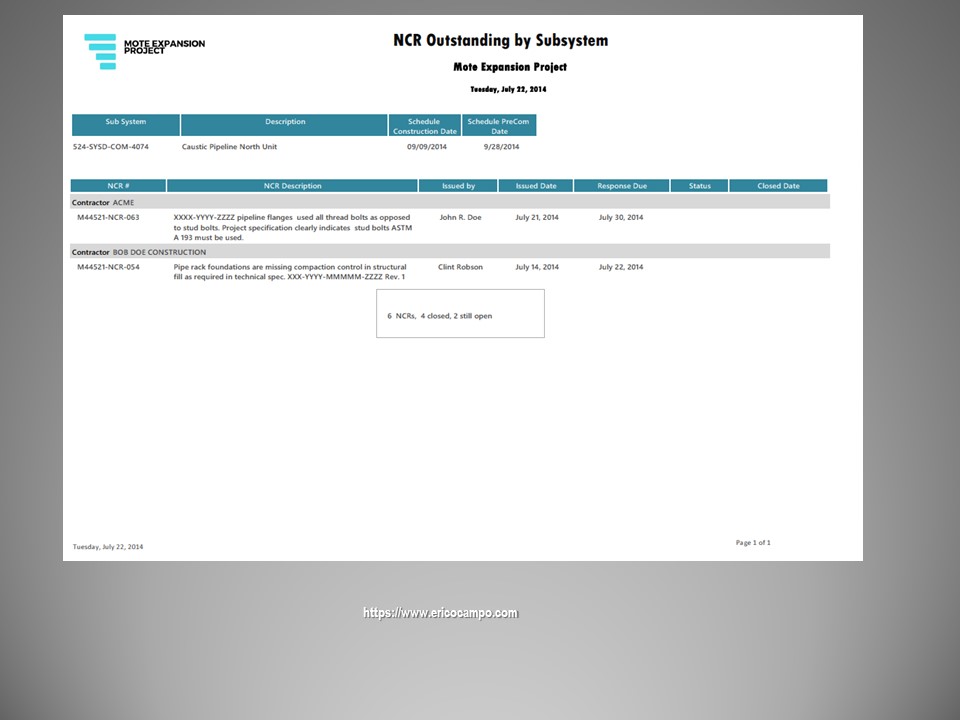
5.- NCR Summary and Status
At any time during the completions process of subsystems, it is important to have a quick way to query the NCR status of any subsystem. Certainly, many times the NCRs were raised early in the project before the subsystemization of the project, or the nature of NCR applies to many subsystems.
Anyway, here is a sample of a quick report that could be generated when NCRs are registered in an MS Access database, in a future post I will discuss a similar one for RFIs .

6.- Skyline charts
Skyline is powerful graphical charts that crosslink the completion status with the subsystem schedules (from Primavera or Project, for example).
Here below is an example of a Precomissioning Skyline. I made this chart using MS Access and Excel.
No alt text provided for this image
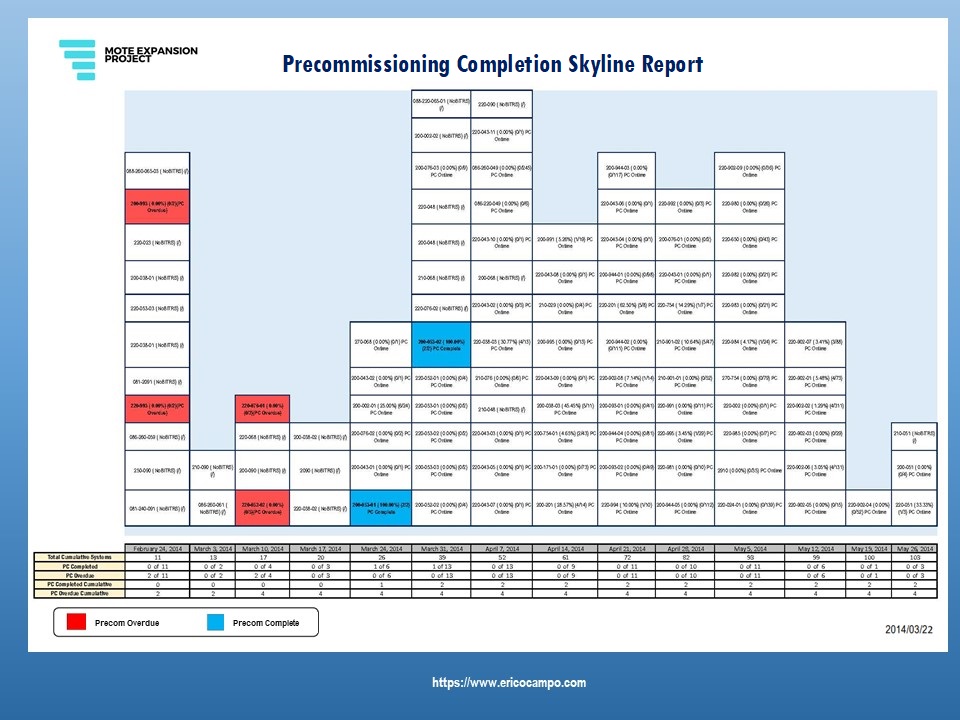
Each box shows the B ITRs completion percentage; red boxes show that subsystem has not completed all its B ITRs, and its schedule date is overdue.
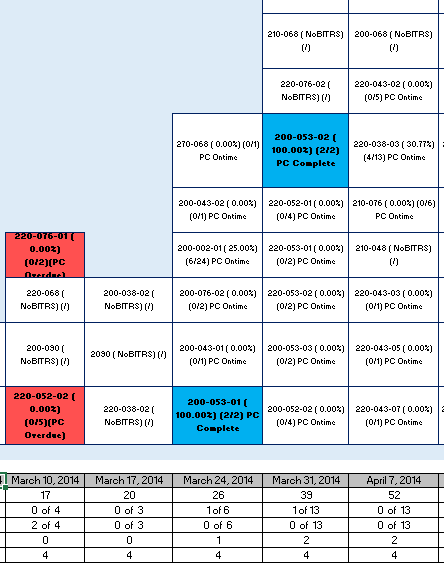
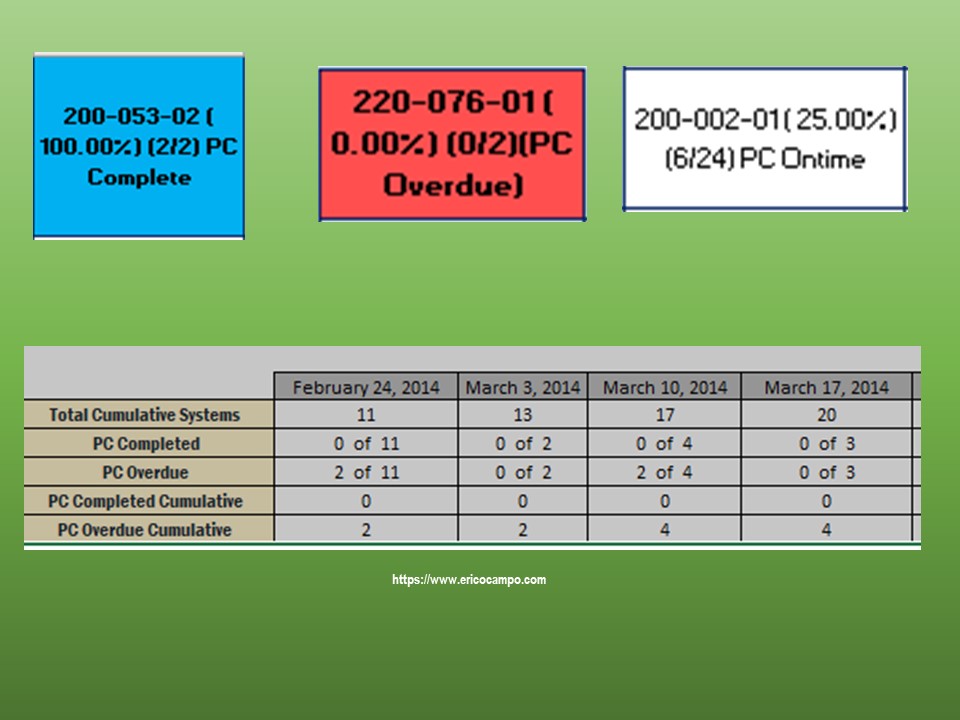
The blue color represents a subsystem that has completed its “B ITRs” on or before its scheduled date.
Also, note that some subsystems show the legend “NoBITRs.”
At the bottom is a weekly cumulative count.
In a future article, I will discuss further other types of skylines.
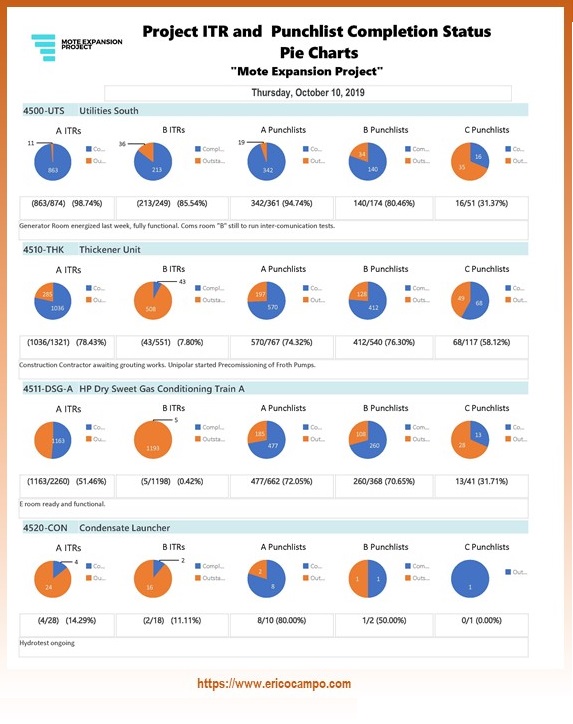
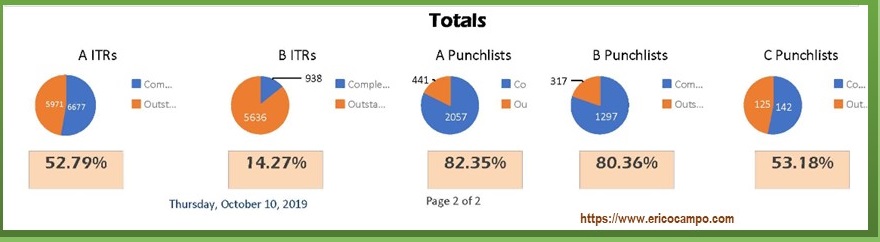
7.- Pie Charts by Unit or Major System
Project Directors and Managers always want to have the big picture right away; if they need more details, they simply ask.
Pie charts per unit or major subsystem are good high-level reports. They show at a glance the completion status in terms of construction, precommissioning, and punchlists. There is also a space for general comments .
Conclusions
EPC projects are complex in data processing, with many reports with different degrees of interconnectivity among them.
In this article I’ve presented examples of separate summaries of A, B ITRs ( or QVDs), and Punchlists per subsystem. I’ve also presented some examples for a Completions Summary from a simple version showing the combined summaries of the first three ( A, B ITRs and Punchlists) to a more comprehensive example to include the status and stage of the Turnover discipline review/approval.
In charts I’ve presented examples of Precommissioning skyline which is a combination of the completion status of B ITRs with the subsystem schedule and, also a “Pie chart” per unit or major system.
I’m aware that there are many more reports (e.g., Preservation, ITRs vs. Schedule dates, Equipment on-site vs. schedule, Line vs. Test Pack by Subsystem, Cause and Effect progress, etc.), but I will discuss them in greater detail in future posts.
Tokyo 2020: I value and applaud the organization of the Olympic Games in the midst of pandemic times. I did follow the classic sports: swimming, basketball, diving, athletics and others not so classic like skateboarding and table tennis. Post-Usain times: I was surprised not to see any Jamaican in the men’s 100 mt finals. Tight race on the gold medals, only the last day USA did manage to surpass China. Canada made an exceptional performance, I expected more medals from Mexico in diving but Chinese divers are exceptional.
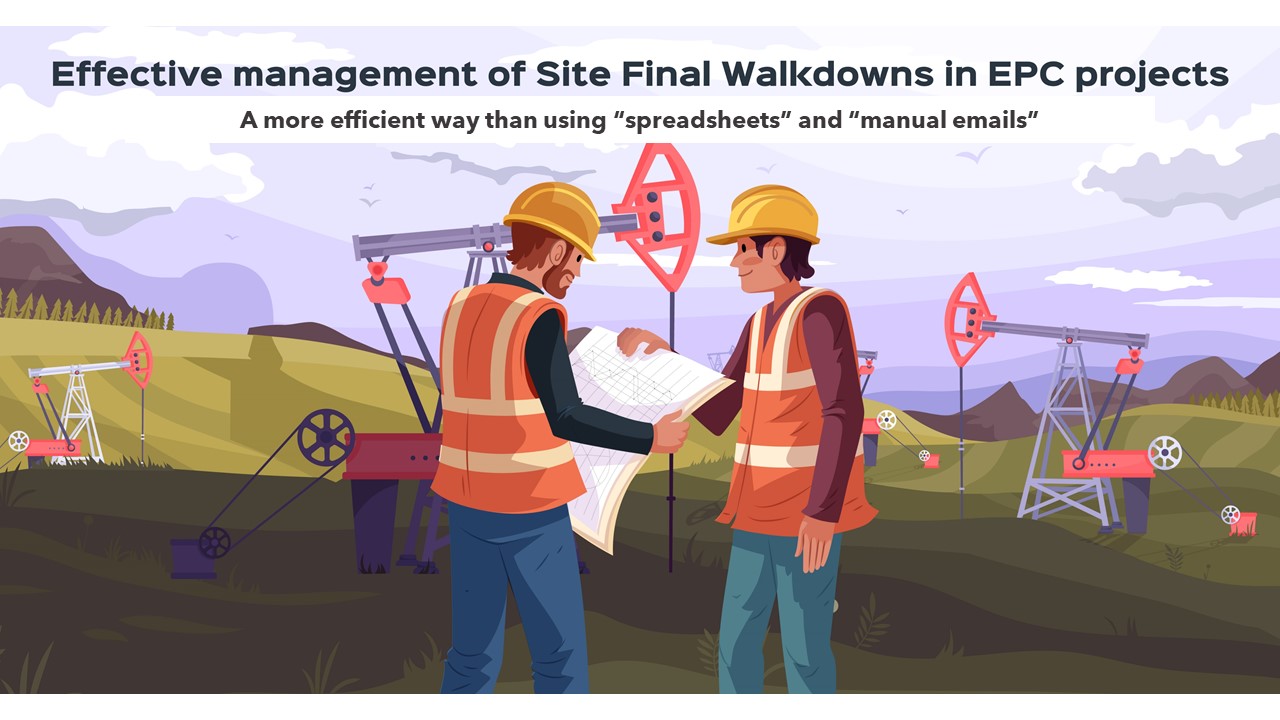
Thanks for your feedback and comments on my previous LinkedIn article: “Effective Management of Site Walkdowns” , I certainly do welcome them.
If you enjoyed this post-article-demo, feel free to comment, like, or share it.
Thank you!
ericocampo@ericocampo.com
Eric Ocampo is a Project Management Professional and Microsoft Access Certified Specialist with an Electronic Sciences Degree. He is a proactive Database Administrator/Developer that has worked in Construction, Oil & Gas projects in North and South America, and the Middle East since 2001. He has worked in Mechanical Completions as System Completions Database Administrator (SCDBA) using GoCompletions, MCPlus, Smart Completions Hexagon and WinPCs, and as a Database Developer, he has developed applications for Project Turnover, Completions, Materials, Preservation, Dossier reviews, Weld Tracking, Instrument loops, etc.
His early experience includes a role as MWD (Measure While Drilling) Operator with Anadrill Schlumberger.