This article was originally published on LinkedIn, April 13th 2018.
”As the twig is bent, so grows the tree”….Same applies to Projects.
Creation of master tag and their system scoping are activities closely related to an efficient Construction, Commissioning, Completions, and Turnover of any Project. One represents the consistent “tagging” of each piece of equipment, and the other is the system assignment for an effective completion and turnover to the client.
It sounds simple but, how many times has a project team been turned upside-down with simple questions or situations like:
- A Master Tag review against drawings resulting in tag duplicates, or tags not scoped in any system?
- Is the current system assignment based on the latest PID revision?
- How many drawings are in each system?
The answers to these questions will indicate how well the project is or is not in control of its own data.
What are the options to manage these interrelations of tags, drawings, and system scoping? On one side there are complete suites and applications that administrate equipment tags created right from the engineering modelling, others automatically pick-up tags from PID/SLD using OCR technology and others use many “Master-spreadsheets”.
Is there any other solution in between? Yes, an MS Access- VBA – SQL application.
Here below is a short video-demo that shows how practical is to:
1.- Open the PID/SLD to be Mapped.
2.- See or assign the systems in the PID/SLD
3.- See or assign tags to the systems within the PID/SLD under mapping and using the Master Tag information in a combo box
4.- Export data into spreadsheet
5.- Validate as completed with date and username of the person that mapped the PID/SLD. ( Useful feature when application is deployed in a multi-user platform)
Mapping PID-System-Tags requires the effective visualization of 3 variables:
1.- One for the PID/SLD or the drawing to be mapped
2.- Other for the system
3.- For the Tag input
Yes, the visualization of these 3 could be in the form of screens or combo boxes (not necessarily 3 monitors) however, 2 monitors in extended mode is indeed helpful.
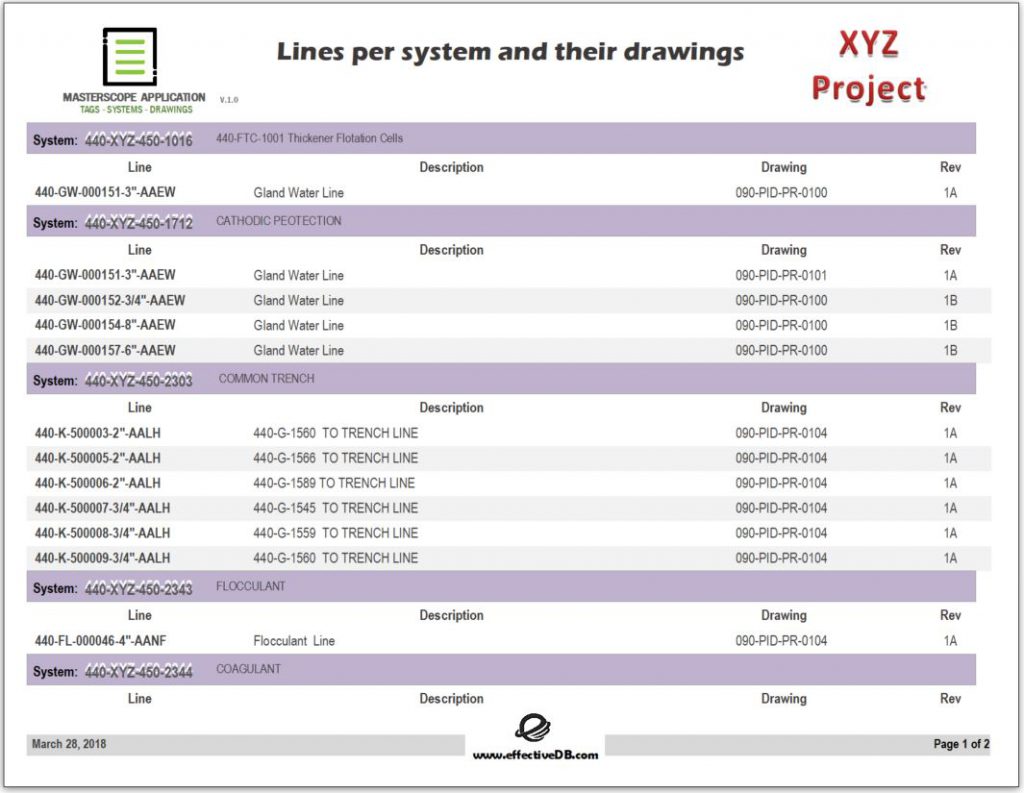
REPORT SAMPLES
Useful for Turnover and Completions that need to see the drawing, system and tags in a single report
Useful for preparing the Punchlist Walkdown Packs.

Useful for preparing TestPacks and Walkdowns
CONCLUSIONS
Tag, System, and Drawing management shouldn’t be that complicated if data is secure, structured and well managed. For instance, a Punchlist Coordinator shouldn’t be wasting time switching between folders, spreadsheets and trips to the printer to prepare walkdown packages; field personnel shouldn’t find issues with duplicate or deleted tags and, the turnover team shouldn’t spend more time formatting spreadsheets than identifying the system scope.
“Projects will continue wasting man-hours as long as they insist in clerical work solutions instead of a true data management approach.”
Thanks for your feedback and comments to my previous post-articles, I certainly welcome them.
If you enjoyed this post-article-demo, feel free to comment, like or share it.
Thank you!
EO

Eric Ocampo is a Project Management Professional and Microsoft Access Certified Specialist with an Electronic Sciences Degree. He is a proactive Database Administrator/Developer that has worked in Construction, Oil & Gas projects in North and South America, and the Middle East since 2001. He has worked in Mechanical Completions as System Completions Database Administrator (SCDBA) using GoCompletions, MCPlus, Smart Completions Hexagon and WinPCs, and as a Database Developer, he has developed applications for Project Turnover, Completions, Materials, Preservation, Dossier reviews, Weld Tracking, Instrument loops, etc.
His early experience includes a role as MWD (Measure While Drilling) Operator with Anadrill Schlumberger.


